Pet food inflation continues on a strong trend, but is slowing, according to John Gibbons of PetBusinessProfessor.com in his latest February 2024 report. February 2024 marked the eighth highest rate for February in history, while back in 2021 it was only half of that.
Total pet inflation dropped significantly from 4.7% in January 2024 to 3.5% in February 2024, stemming from a continued decline in pet food prices. Pet food prices have now decreased for three straight months.
The YOY national Consumer Price Index (CPI) were +0.6% from January and +3.2% vs. February 2023, up from the 3.1% last month.
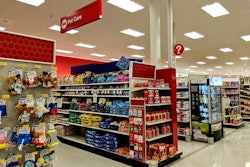
In February, pet food prices came in at +2.6% down compared to January’s number of +4.8%. Pet food prices passed the national CPI in July 2022, and at 3.5% in February, it is still 9% above the national rate but down from +52% in January.
When comparing pet food prices to the CPI from two years ago (February 2022), CPI was +10.4% and pet food prices were +7.0%, meaning pet food prices were considerably higher two years ago.
2022 compared to 2024
- U.S. CPI – Prices are +0.6% from January. The YOY increase is 3.2%, up from 3.1%. It peaked at +9.1% back in June 2022. The targeted inflation rate is <2% so we are still 60% higher than the target.
“After 12 straight declines, we had 2 lifts, a stable month, 2 consecutive drops, now 3 lifts – not good news,” said Gibbons.
The current rate is 47% below 22>23 but the 21>24 rate is still 18.0%. That is 78.9% of the total inflation since 2019. Inflation was low in early 2021.
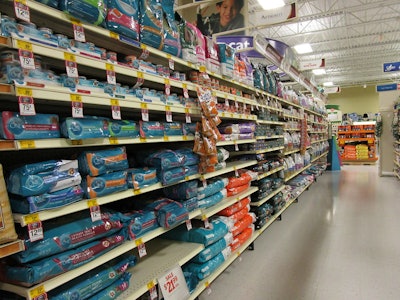
- Pet food – Prices are -0.9% vs January and +2.6% vs February 23, down from 4.8%. However, they are still 2.6 times the Food at Home inflation rate. The YOY increase of 2.6% is being measured against a time when prices were 20.7% above the 2019 level, but that increase is still 1.5 times the pre-pandemic 1.7% increase from 2018 to 2019. The 2021>2024 inflation surge has generated 91.8% of the total 24.5% inflation since 2019.
YOY -- 2022 compared to 2024
- U.S. CPI – The 23>24 rate is 3.1%, the same as January, but down 50% from 22>23 and 60% less than 21>22. It is also 26% below the average YOY increase from 2019>2024, but it’s still 72% more than the average annual increase from 2018>2021. 79% of the 20.6% inflation since 2019 occurred from 2021>24. Inflation is a big problem that started recently.
- Pet food – YTD inflation is 3.7%, down from 4.8% in January and 75% less than the 22>23 rate. However, it is still 16% higher than 21>22 and 2.3 times the average rate from 2018>2021. Pet Food has the highest 22>23 rate on the chart but has fallen to 2nd in the 21>24 rates. Deflation in the first half of 2021 kept YTD prices low then prices surged in 2022 and especially in 2023. 91% of the inflation since 2019 occurred from 2021>24.
Pet inflation is cumulative
“One fact is often ignored in the headlines - Inflation is cumulative,” stated Gibbons. “Pet prices are 21.0% above 2021 and 25.6% higher than 2019. Those are big lifts.”
February’s prices for all segments, but pet food, are the highest in history.
Even though pet food prices are decreasing, they are only 1.3% lower than their May 2023 peak and 24.5% higher than in 2019.